About TFM Quantitative Trading

TFM Quantitative Trading is an independent proprietary trading and quantitative research firm focused on systematic, automated trading using its own capital.

We develop, test, and operate algorithmic trading systems built around data, statistical analysis, backtesting, execution infrastructure, and live risk controls.

Our work combines quantitative research, software engineering, market analysis, and disciplined operational risk management. The objective is the continuous development of robust, rule-based strategies and the infrastructure to deploy them reliably.

TFM Quantitative Trading is a purely proprietary operation — it does not manage client money, provide investment advice, or offer trading signals. Its activity is focused on proprietary research and the deployment of internal automated trading systems.

The story

From Tomatoes From Mars™ to TFM Quantitative Trading

From research to a proprietary trading firm

TFM Quantitative Trading began as an independent research initiative known as Tomatoes From Mars™ (Market Analysis Research System), where quantitative models were developed to study market behaviour, volatility dynamics, and systematic trading opportunities. What started as a research-driven project gradually evolved into a fully automated trading ecosystem — integrating data processing, backtesting frameworks, execution algorithms, and live risk controls.

With consistent real-world application and ongoing optimisation, the operation matured into a proprietary quantitative trading firm operating under the TFM brand. TFM Quantitative Trading now focuses on deploying algorithmic strategies using its own capital, prioritising robustness, automation, and disciplined risk management over speculative or discretionary approaches.

The firm’s mission is simple:
To compound capital steadily through systematic, data-driven trading while continuously advancing its quantitative infrastructure.
The different aspects of quantitative trading

A definition + what makes it “quant”

The core idea

In traditional discretionary trading, decisions often depend on a trader’s subjective interpretation of charts, news, or intuition. In quant trading, the goal is to make decisions that are explicit, repeatable, and measurable.

  • Explicit rules: “If X happens, do Y” (or a model outputs a probability / expected return).
  • Evidence: strategies are tested on historical data and stress-tested for robustness.
  • Risk first: position sizing, drawdown limits, and execution are part of the system—not an afterthought.

What makes something “quant”?

“Quant” doesn’t require AI. A strategy can be quant if it’s systematic and testable.

  • Uses data (prices, volume, fundamentals, macro, options, alternative data).
  • Uses statistics / probabilities (even basic ones).
  • Can be automated, partially automated, or executed manually with strict rules.
A helpful mental model: quant trading is a software-engineering approach to markets. You define requirements (objectives), design an algorithm (rules/models), test it, deploy it, monitor it, and iterate.

The quant trading pipeline

From idea → production

1) Define the objective

Optimise for long-term growth, low drawdown, steady returns, hedging, or a mix.

  • Pick instruments (indices, FX, futures, equities, options…)
  • Pick timeframe (intraday, swing, long-term)
  • Write down constraints (max leverage, max drawdown, liquidity needs)

2) Data + cleaning

Good research is mostly data hygiene: correct timestamps, corporate actions, survivorship bias, etc.

  • Price/volume data, corporate actions, economic calendars
  • Handle missing data & outliers
  • Align series (timezones, holidays, sessions)

3) Feature engineering

Turn raw data into measurable signals: returns, volatility, momentum, carry, spreads, regimes.

  • Indicators (moving averages, ATR, RSI…)
  • Risk regimes (volatility states, correlations)
  • Macro & fundamentals (rates, inflation, earnings)

4) Signal design

Define entries/exits: thresholds, ranking, classifiers, or forecasts.

  • Rule-based (if/then)
  • Statistical models (regression, HMMs, filters)
  • Machine learning (only if it truly adds value)

5) Backtesting

Simulate the strategy on history with realistic costs and constraints.

  • Include spreads, commissions, slippage
  • Test multiple market regimes
  • Avoid overfitting (walk-forward, out-of-sample)

6) Risk management

Risk management is the difference between a nice backtest and a survivable system.

  • Position sizing (vol targeting, Kelly-inspired, fixed fraction)
  • Portfolio limits (max exposure, sector/country caps)
  • Kill-switches (max daily loss, max drawdown)

7) Execution

How orders reach the market matters: latency, liquidity, market impact, and broker rules.

  • Order types (market/limit/stop), partial fills
  • Timing (open/close, auctions, sessions)
  • Transaction cost analysis (TCA)

8) Monitoring + iteration

Production is a living system: monitor performance, data feeds, and strategy drift.

  • Alerts for outages & abnormal behaviour
  • Performance attribution (what drove P&L?)
  • Research improvements as markets change
Reality check: in real trading, the “edge” can be smaller than expected. Most of the work is preventing small problems (bad data, execution costs, overfitting) from destroying the edge.

Tomatoes From Mars®

Finding promising trading seeds

TFM discovery layer

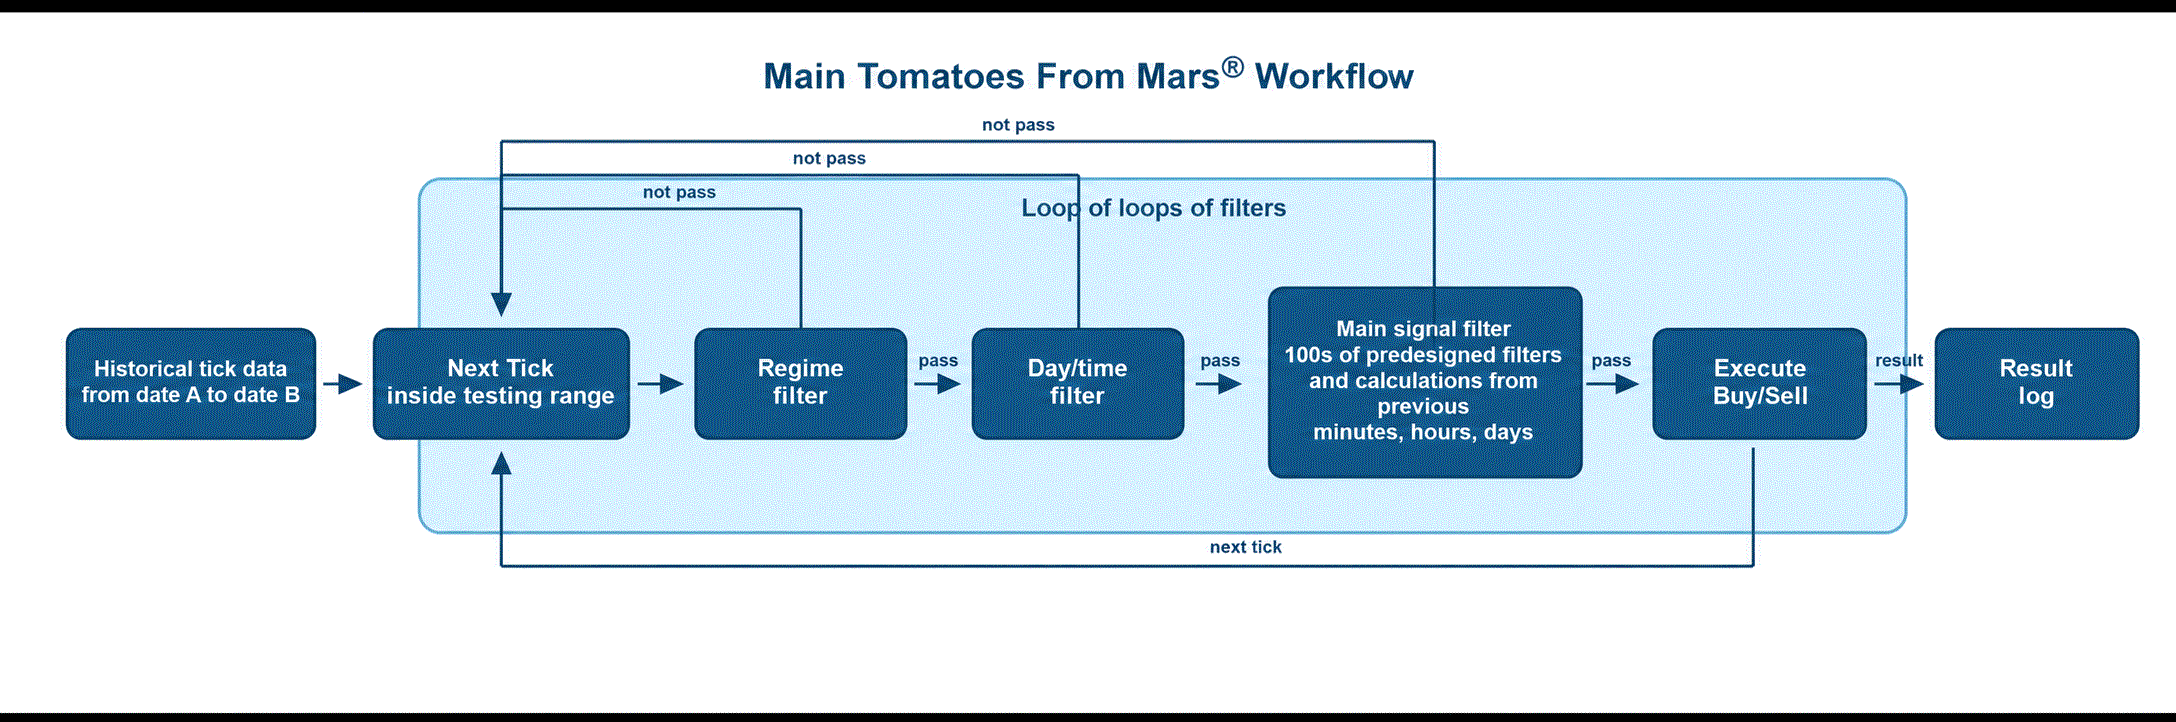
Tomatoes From Mars® is TFM's research framework for finding promising trading “seeds,” not finished strategies. It scans historical tick data through a structured workflow: testing range, regime filter, day/time filter, main signal filter, simulated execution, and result logging.

Tomatoes From Mars® workflow diagram showing testing range, regime filter, day/time filter, main signal filter, simulated execution, result logging, and next tick loop
Tomatoes From Mars® workflow: a repeated filter-and-test process over historical tick data.

What it is looking for

The purpose is to identify combinations of market regime, timing, and signal behaviour that are interesting enough to investigate further. After that, the real work begins: deeper robustness checks, parameter sensitivity, different market periods, execution assumptions, risk management, and especially controlling overfitting with out-of-sample testing.

The main signal filter

The main signal filter is the core idea being tested. It can represent many different predefined market conditions, such as price movement, candle behaviour, momentum, volatility, distance from previous highs/lows, or patterns calculated from previous minutes, hours, or days. Tomatoes From Mars® tests these signal ideas systematically, often in combination with regime and time filters, to see which ones are worth deeper investigation.

Discovery, not conclusion: Tomatoes From Mars® helps find ideas worth studying, but a seed only becomes useful if it survives deeper validation outside the data used to find it.

Common styles of quant strategies

Different edges, different risks

Trend / momentum

Attempts to capture persistent moves. Often performs well in sustained trends; can struggle in choppy markets.

  • Time-series momentum
  • Cross-sectional momentum
  • Breakouts

Mean reversion

Buys weakness and sells strength based on the assumption prices revert toward a typical level.

  • Pairs / spread trading
  • Intraday reversals
  • Volatility-based dips

Carry

Harvests a “roll” or yield component (rates, futures curves, FX interest differentials). Sensitive to shocks.

  • FX carry
  • Bond futures carry
  • Commodity term structure

Value / fundamentals

Ranks instruments by fundamental metrics and rebalances over weeks/months. Needs clean data and patience.

  • Factor investing
  • Quality / profitability signals
  • Rebalancing rules

Statistical arbitrage

Exploits statistical relationships in diversified portfolios. Often requires careful execution and risk controls.

  • Equity long/short
  • Market-neutral baskets
  • Multi-signal combos

Options / volatility

Trades implied vs realized volatility, skew, term structure, or hedging flows. Complexity is higher.

  • Volatility selling/buying
  • Dispersion
  • Hedging strategies
Most real systems are hybrids: for example, a trend strategy with volatility targeting, or a mean-reversion strategy that turns off during high-volatility regimes.

Risk management

Sizing, limits, and drawdowns

Position sizing basics

Many strategies fail not because the signal is wrong, but because the position is too large. Common sizing approaches:

  • Fixed fraction: risk a fixed % of equity per position.
  • Volatility targeting: smaller positions when volatility rises.
  • Risk parity: allocate to equalize risk contribution.

Portfolio and system limits

Controls that prevent a single idea, market, or outage from causing catastrophic loss.

  • Maximum leverage / margin usage
  • Maximum exposure per asset/class
  • Max daily loss and max drawdown “kill switch”
  • Diversification + correlation monitoring

Why drawdowns matter

If there is a 50% loss, there is a need for a 100% gain to get back to break even. Most quant systems aim to control drawdowns so the strategy can survive long enough for its edge to play out.

Educational note: This is not advice. Risk controls depend on instrument, leverage, liquidity, and personal circumstances.

Myths and common mistakes

What to watch out for

Myth: “AI guarantees profits”

Machine learning can help in some settings, but markets are noisy, non-stationary, and competitive. If the data doesn’t contain a stable predictive signal, a more complex model won’t fix that.

Mistake: overfitting

A backtest can look amazing if the strategy is tuned too much to the past. Use out-of-sample testing, walk-forward, and keep models simple unless complexity is justified.

Mistake: ignoring costs

Transaction costs (spread, commission, slippage) can erase the edge—especially at high frequency. Model them conservatively.

Mistake: poor execution & monitoring

Even a good strategy can fail in production due to outages, stale data, or broker constraints. Monitoring and alerting are part of the strategy.

A good quant system is boring by design: repeatable, resilient, and disciplined. If it relies on constantly “saving” it with discretion, it’s not really systematic.

FAQ

Quick answers
Is quant trading only high-frequency trading (HFT)?

Not at all. Quant strategies exist from millisecond horizons (HFT) to monthly rebalancing (factor investing). The defining feature is systematic, testable decision-making.

What is the “edge” in quant trading?

An edge is any repeatable advantage that results in positive expected value over time. It can come from behavioral effects, structural market frictions, risk premia, or better execution.

Why do strategies stop working?

Markets evolve: participants adapt, regulations change, liquidity shifts, and correlations break. Some edges are temporary. Robust monitoring and periodic research updates help.

Contact / About

About this site

Quantitative trading, research and proprietary trading.

Email: contactweb@tfmquantitativetrading.com

Disclosure

Informative content only. Proprietary trading firm. No external investment accepted.

Intellectual Property

Unless otherwise stated, the content of this website, including research materials, methodologies, text, graphics, software, documentation and other original material, is the property of TFM Quantitative Trading Ltd or its respective rights holders and is protected by applicable intellectual property laws.

No content from this website may be reproduced, distributed, modified, republished or used for commercial purposes without prior written permission from TFM Quantitative Trading Ltd, except where permitted by law.

Tomatoes From Mars® and other names, logos and branding used by TFM Quantitative Trading Ltd are protected by trademark and other intellectual property rights.